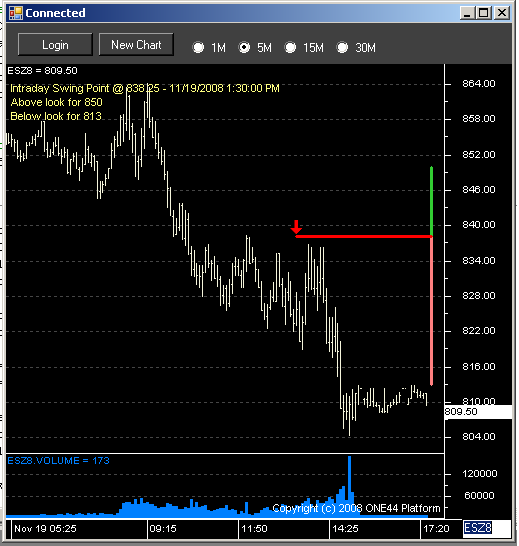
[BETA] Realtime charts that show the current swing point with targets.
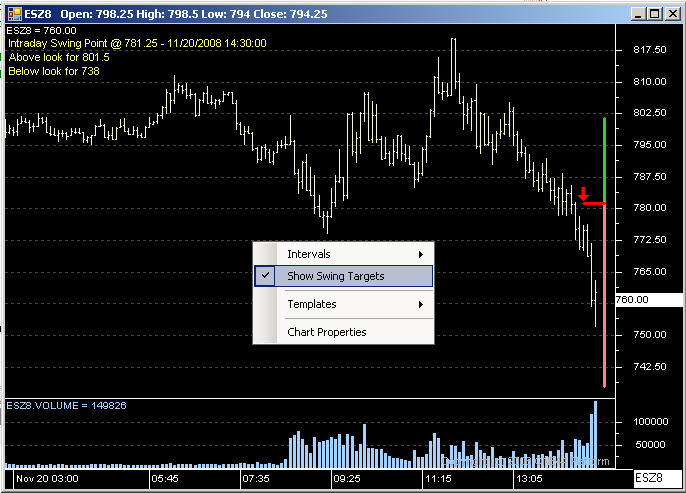
You can see the full swing point targets by right clicking the mouse on the chart and selecting Show Swing Targets.
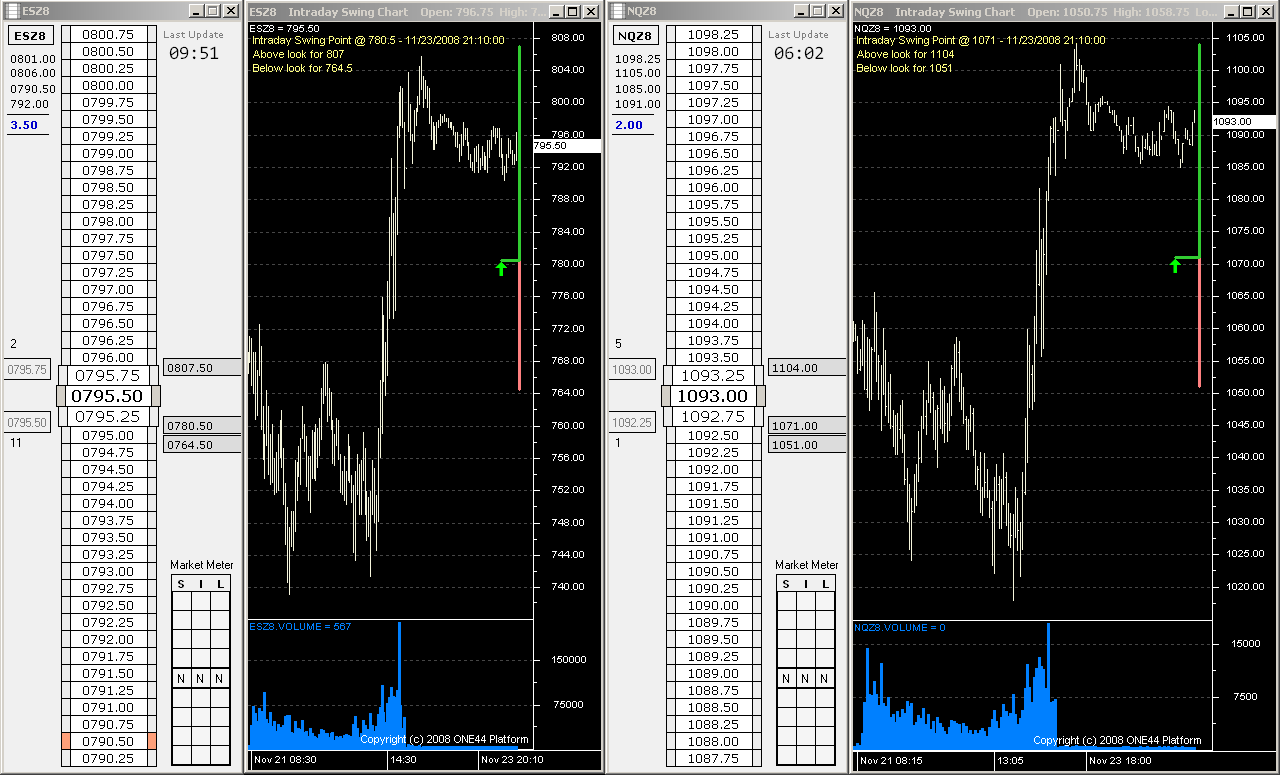
The arrow will be colored green if the market is above the swing point and
red if it is below.
The swing targets will flash upon a swing point
update.
The bar above the arrow will also change color with the arrow and will start at the approximate time the new swing point was set.
See also, How to Understand Swing Point Charts